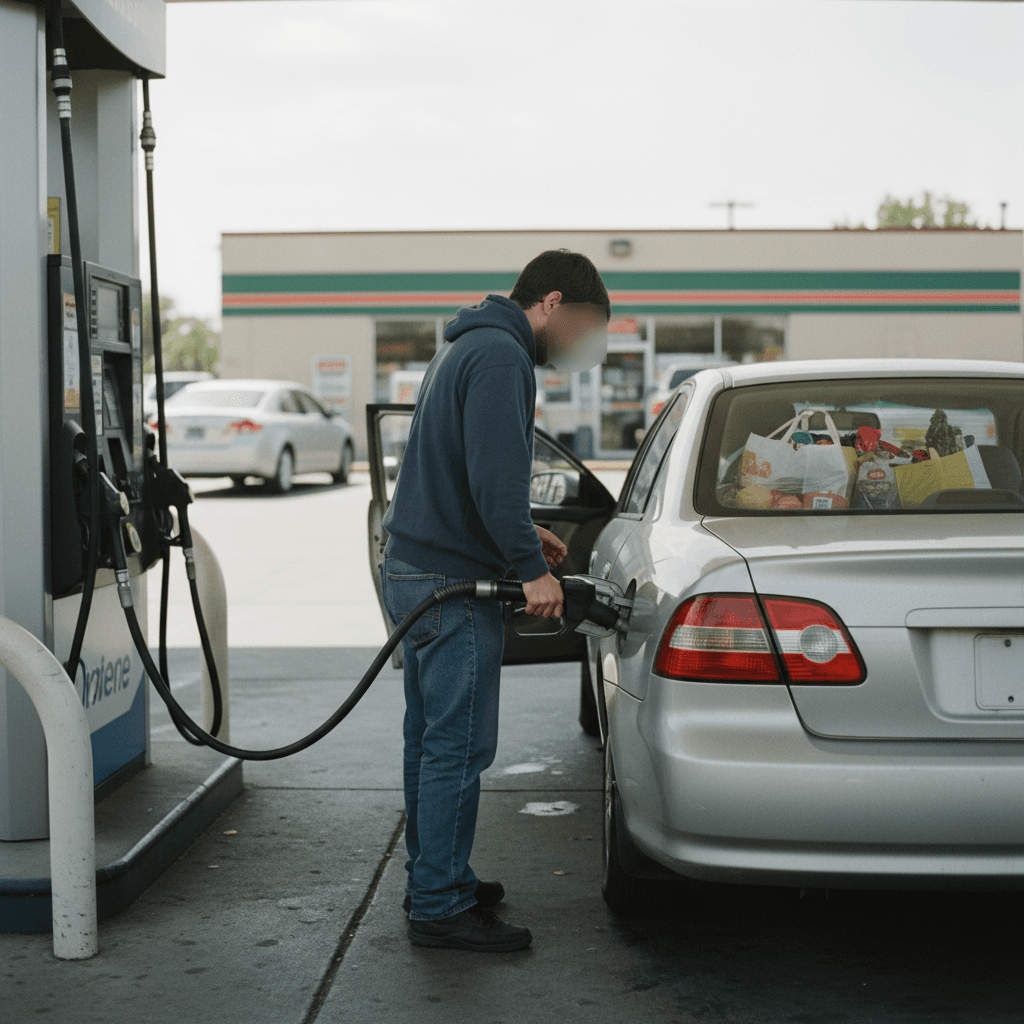
Gas Fell From $4.56 to $3.83. How to Bank the Difference Before It Reverses
Pump prices dropped roughly 50 cents in a month after peaking at $4.56 in May. That's a real raise for driving households, and it will quietly disappear into everyday spending unless you capture it deliberately.
The national average for a gallon of regular gasoline fell to about $3.83 in early July, down roughly 50 cents from a month earlier. That followed a spring peak of $4.56 on May 21.
The June Consumer Price Index confirmed the scale of it: gasoline prices fell 9.7% for the month, and energy overall dropped 5.7%. That energy decline is the main reason the headline CPI fell 0.4% in June despite grocery prices continuing to rise.
For a household that drives, this is a genuine and immediate increase in disposable income. It is also the kind of increase that vanishes without a trace unless you do something specific about it.
Key Takeaways
- ✓The national average fell to roughly $3.83 in early July from a May 21 peak of $4.56, a decline of about 73 cents per gallon.
- ✓For a household using 100 gallons a month, that is roughly $73 a month in freed-up cash - about $876 annualized if it holds.
- ✓Prices vary enormously by state, from about $3.06 in Indiana to $5.46 in Hawaii, so your actual savings depend heavily on where you live.
- ✓Crude oil in the $60-per-barrel range is what drove the decline, and crude is volatile - this is a window, not a new baseline.
- ✓Unallocated savings get absorbed by ordinary spending; automating the difference into savings is the only reliable way to keep it.
What This Is Worth to You
The honest answer is that it depends entirely on how much you drive and where you live.
Here is roughly what the drop from the $4.56 May peak to about $3.83 is worth at different consumption levels:
| Monthly gallons | Typical driver profile | Monthly savings | Annualized |
|---|---|---|---|
| 40 | Light commute, mostly local | about $29 | about $350 |
| 70 | Average single-car household | about $51 | about $613 |
| 100 | Two cars or a long commute | about $73 | about $876 |
| 150 | Heavy driving, rural, or rideshare | about $110 | about $1,314 |
Geography changes this substantially. As of mid-July, Hawaii led the nation at about $5.46 per gallon, followed by California at $5.37 and Washington at $5.02. At the other end, Indiana averaged about $3.06, with Oklahoma and Texas both near $3.32.
A driver in Indiana and a driver in California are having genuinely different financial experiences of the same national average, which is worth remembering every time you read a national statistic about anything.
Why It Happened, and Why It Might Not Last
Gasoline prices track crude oil with a lag, plus refining costs, taxes, and regional distribution factors. The current decline traces primarily to crude falling into the $60-per-barrel range, its lowest level in months.
Two reasons to treat this as a window rather than a new normal:
Crude is volatile. Oil prices respond to production decisions, geopolitical events, and demand shifts, none of which are predictable on a monthly timeline. The same mechanism that delivered a 50-cent decline can reverse it.
The trend already showed signs of turning. After declining steadily from late May, the national average ticked up about 5 cents in a single overnight move in mid-July, to roughly $3.84. That is not a reversal on its own, but it is a reminder that the direction is not guaranteed.
The financially useful stance: treat this as a temporary windfall to be captured, not a permanent raise to be spent.
The Behavioral Problem
Here is the pattern that makes savings like this evaporate.
When an expense drops without you doing anything, the money does not appear anywhere visible. There is no deposit, no notification, no line item that says "you saved $73 this month." The money simply fails to leave your checking account.
Money that fails to leave a checking account gets spent on something else. Not through any decision - through the ordinary process of spending expanding to fill available balance. Behavioral economists have documented this repeatedly, and most people have experienced it without naming it: a raise, a paid-off car loan, or a dropped subscription that somehow produced no change in savings.
The countermeasure is to make the invisible savings visible by moving it. This is the entire technique, and it works because it converts a passive non-expense into an active transfer you can see.
How to actually do it
-
Estimate your own number. Look at one month of gas purchases from your bank or card statement. Compare to a month during the spring peak. The difference is your figure - not the national average, yours.
-
Set up an automatic transfer for that amount, timed for the day after payday. If your number is $60, transfer $60. You were paying it in May and your budget survived, so your budget will survive it now.
-
Send it somewhere with a purpose and a yield. A high-yield savings account paying in the low-to-mid 4% range, versus a national average savings rate around 0.38%. Name the account for its goal - "Emergency Fund," "Car Repairs" - because named accounts get raided less than generic ones.
-
Leave it alone when gas prices rise again. This is the part people skip. When pump prices reverse, the natural move is to cancel the transfer. Instead, absorb the increase elsewhere if you can. The transfer becomes a permanent habit rather than a temporary one.
Where to Point the Money
The right destination depends on where you are in the standard sequence.
If you have no emergency fund: This goes to a starter fund, target $1,000. At $73 a month, that is roughly 14 months, and faster if you add anything else. A $1,000 cushion covers the majority of common financial emergencies and stops the cycle of putting surprises on a credit card. Our emergency fund guide covers the full build.
If you have high-interest debt: This goes to the highest-APR balance you carry. With most credit cards near 22% APR and the Fed showing no signs of cutting, paying down card debt is a guaranteed return no savings account can match. Our payoff guide covers the sequencing.
If your emergency fund is funded and you carry no expensive debt: This goes to retirement or a specific savings goal. At $73 a month invested consistently over 20 years at a 7% average return, you would be looking at meaningfully more than $35,000 - from a change that costs you nothing in lifestyle, because you were already paying it in May.
That last point is the one worth sitting with. The most painless money you will ever save is money you were already spending three months ago.
A Note on Timing Fill-Ups
While we are on the subject, a few things that genuinely matter and a few that do not.
Worth doing: Using a gas price app to find the cheapest station on a route you already drive. Price spreads of 30 to 50 cents per gallon within a few miles are common. Paying with a card that offers meaningful fuel rewards, provided you pay the balance in full. Keeping tires properly inflated, which has a small but real effect on fuel economy.
Not worth doing: Driving materially out of your way to save a few cents per gallon. If you burn a quarter gallon driving to a station that saves you 10 cents on a 12-gallon fill, you saved $1.20 and spent roughly a dollar in fuel plus your time. Also not worth it: filling up at specific times of day or days of the week, which is folklore rather than a reliable pattern.
For the broader summer driving picture, our earlier summer gas prices and driving budget coverage goes further, and the June CPI breakdown covers what happened to grocery prices during the same period.
Frequently Asked Questions
How much have gas prices actually fallen?
The national average dropped to roughly $3.83 per gallon in early July, about 50 cents below the prior month and down from a spring peak of $4.56 on May 21. The June CPI recorded gasoline prices falling 9.7% for the month. Your local decline may differ substantially depending on your state.
Will gas prices keep falling?
Nobody can reliably predict this. The decline was driven by crude oil falling into the $60-per-barrel range, and crude prices are volatile. The national average already ticked up about 5 cents in a single move in mid-July after declining since late May. Plan on the basis that current prices are a window rather than a permanent level.
Why do gas prices vary so much between states?
State fuel taxes, environmental fuel blend requirements, distance from refineries, and regional distribution costs. That is why Indiana can average around $3.06 while Hawaii averages about $5.46. State tax and blend requirements explain most of the persistent gap between the West Coast and the middle of the country.
Is $73 a month actually worth setting up a transfer for?
Yes, for two reasons. Annualized it is roughly $876, which is a meaningful emergency fund contribution or debt payment. More importantly, the transfer habit tends to outlast the specific savings that started it. People who automate a windfall usually keep the transfer running well after the windfall ends, which is where the real long-term benefit comes from.
Gas price figures cited come from AAA data as of July 2026, and inflation data from the Bureau of Labor Statistics June 2026 Consumer Price Index. Current national and state averages are published at gasprices.aaa.com.
Financial Disclaimer: This article is for informational purposes only and does not constitute financial advice. Always consult a licensed financial advisor before making financial decisions.

Founder & Editor
Francis founded WealthWire Daily to explain US personal finance using primary sources. He is not a licensed financial advisor.
Discussion & Comments
You Might Also Like

Inflation Cooled to 3.4% in July. Wages Grew 3.2%. You Are Still Losing Ground.
July's CPI came in slightly cooler at 3.4%, and the coverage called it good news. But prices are still rising faster than pay, gasoline is up 24.6% from a year ago, and shelter drove two-thirds of the increase.

How to Read Inflation Data Without Getting Misled by the Headline
The CPI headline almost never describes your actual cost of living. Here's how to read the report the way an economist does, find the categories that affect your budget, and ignore the rest.

How to Read the Job Market as a Household (Not an Economist)
The unemployment rate can fall while the job market gets worse. Here's how to read employment data for the signals that actually predict your job security, your raise, and when to build cash.