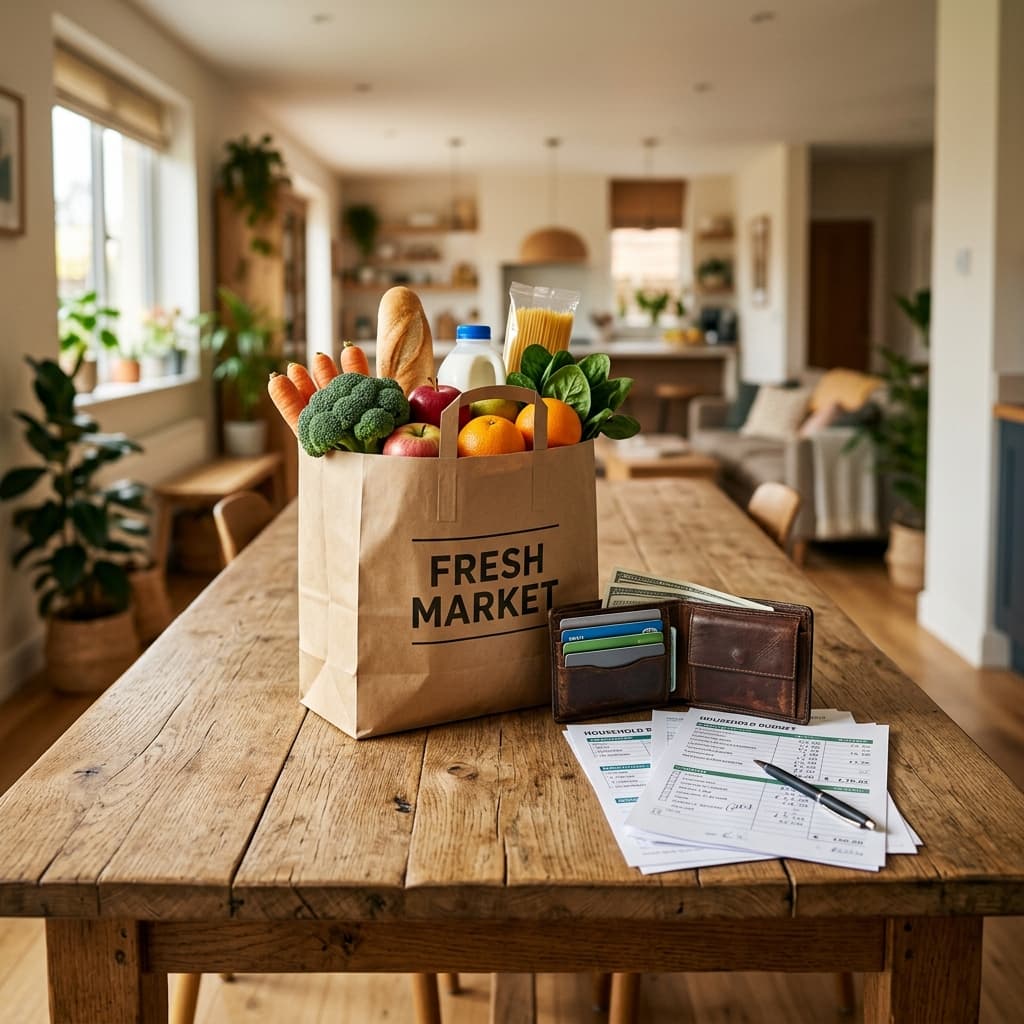
Inflation Cooled to 3.4% in July. Wages Grew 3.2%. You Are Still Losing Ground.
July's CPI came in slightly cooler at 3.4%, and the coverage called it good news. But prices are still rising faster than pay, gasoline is up 24.6% from a year ago, and shelter drove two-thirds of the increase.
The Bureau of Labor Statistics released July's Consumer Price Index on Wednesday. Prices rose 0.1% for the month and 3.4% over the past year, down from 3.5% in June. Core inflation, which strips out food and energy, eased to 2.5% from 2.6%.
Every number came in exactly where economists expected. Most coverage framed it as inflation cooling.
Here is the number that did not make the headlines: wage growth is running at about 3.2%. Inflation is running at 3.4%. Prices are still rising faster than pay.
That gap is small, and it has now persisted for months. A household reading "inflation cooled" and expecting relief in their budget is going to be confused when the budget does not feel any different, because in real terms it is still getting slightly worse.
Key Takeaways
- ✓Headline inflation eased to 3.4% year over year and core cooled to 2.5%, both matching forecasts exactly.
- ✓Wage growth is running near 3.2%, so pay is still losing to prices in real terms.
- ✓Gasoline fell 2.9% for the month but remains 24.6% higher than a year ago, which is why the pump feels expensive despite falling.
- ✓Shelter rose only 0.1% for the month yet accounted for roughly two-thirds of the entire CPI increase, because of its enormous weight.
- ✓Cooling core inflation slightly weakens the case of the three Fed officials who dissented in July in favor of a rate hike.
What the Report Actually Said
| Measure | July 2026 | Prior month |
|---|---|---|
| Headline CPI, monthly | +0.1% | -0.4% |
| Headline CPI, annual | 3.4% | 3.5% |
| Core CPI, monthly | +0.2% | - |
| Core CPI, annual | 2.5% | 2.6% |
Both annual figures ticked down by one tenth. That is genuine progress, and it is also very slow progress. Core inflation at 2.5% remains above the Federal Reserve's 2% target, where it has now been for more than five years.
The direction is right. The distance left to travel is what the Fed is arguing about.
The Real Story: Pay Versus Prices
The most useful thing you can do with any inflation number is compare it to your own income, and the aggregate version of that comparison is not flattering.
With inflation at 3.4% and wage growth near 3.2%, the average worker's purchasing power shrank by roughly 0.2% over the year. Small, but negative, and it follows a long stretch of the same.
What this means practically:
| Your raise this year | Inflation | What actually happened |
|---|---|---|
| 2.0% | 3.4% | You took a 1.4% pay cut |
| 3.2% | 3.4% | Roughly flat, slightly behind |
| 3.4% | 3.4% | You broke even |
| 5.0% | 3.4% | A real 1.6% raise |
This is why "inflation is cooling" and "my budget still feels tight" are both true statements. Cooling inflation means prices are climbing more slowly. It does not mean prices are falling, and it does not mean your income has caught up to the climbing they already did.
The practical implication: a cost-of-living adjustment that matches inflation is not a raise, it is maintenance. If your income has tracked at or below 3.2% for the past couple of years, your real standard of living has drifted down even though your paycheck grew. Getting ahead requires a promotion, a job change, a new credential, or income outside your main job, not an annual adjustment.
Gasoline: Down for the Month, Up 24.6% for the Year
This is the single best illustration of why monthly and annual figures answer different questions, and why headlines confuse people.
Gasoline prices fell 2.9% in July, following a 9.7% drop in June. Two consecutive monthly declines.
Gasoline prices are also 24.6% higher than they were a year ago. Fuel oil is up 39.1%.
Both statements are true. If you read only the monthly number, fuel costs are improving. If you read only the annual number, fuel costs are punishing. What is actually happening is that prices spiked hard earlier in the year and have been retreating from that spike, but they have not retreated all the way back to where they started.
This is why the pump can feel expensive during a month when prices are falling. Your memory is anchored to last summer. The monthly change is anchored to last month.
For how to read these two figures without getting whipsawed by coverage, see our guide to reading inflation data.
Shelter Did Most of the Work
Here is a detail worth understanding, because it explains how a "small" number can dominate a report.
Shelter rose just 0.1% for the month, the second consecutive month at that pace. Annually it is up 3.2%.
Yet shelter accounted for roughly two-thirds of the entire CPI increase in July.
How does the slowest-moving category drive most of the change? Weight. Housing is by far the largest component of the index, because it is by far the largest line in most household budgets. A tiny percentage move on an enormous base outweighs a large percentage move on a small one.
Two takeaways follow from that:
For reading the data: never judge a category's impact by its percentage change alone. Multiply by how much of your budget it consumes. A 30% jump in a category you spend 1% of your income on is noise. A 3% rise in housing is not.
For your own budget: the same arithmetic applies to you personally. If housing is 35% of your spending, then your personal inflation rate is dominated by your rent or mortgage, regardless of what happens to anything else. A fixed-rate mortgage insulates you from most of this. A lease renewal does not.
Groceries: The Average Still Hides Everything
Grocery inflation held at 2.7% over the past twelve months, unchanged from June. As usual, the average conceals a wide spread:
| Category | Year over year |
|---|---|
| Fruits and vegetables | +5.1% |
| Nonalcoholic beverages | +4.1% |
| Cereals and bakery products | +2.7% |
| Meats, poultry, fish, and eggs | +1.9% |
| Dairy | -0.5% |
| Food at home overall | +2.7% |
Dairy is genuinely cheaper than a year ago. Fruits and vegetables cost 5.1% more. The gap between the best and worst category is more than five percentage points, which is far more than the headline grocery number moved all year.
The actionable version: if your grocery spending has been climbing faster than 2.7%, the cause is probably your category mix rather than general inflation, and shifting within categories is where the savings actually are. Produce is the category to buy strategically right now, favoring frozen and sturdier fresh items over the most perishable options.
What It Means for the Fed
This report is the first inflation reading since the July 29 meeting, where the Fed held rates but three officials dissented in favor of a hike. That was the most hawkish FOMC split since 2016, and we covered what it meant in our breakdown of the July decision.
July's data slightly weakens the hawks' position. Core inflation moving from 2.6% to 2.5% is movement in the direction they wanted, achieved without a rate increase. It is harder to argue for tightening when the number is already falling on its own.
It does not resolve the argument. Core at 2.5% is still above the 2% target, and the dissenters' underlying complaint is that inflation has been above target for over five years, which one tenth of a percentage point does not fix.
The broader read is that this report supports holding rates steady in September rather than moving in either direction. For households, the practical conclusion has not changed since July: do not build a plan that requires a rate cut. There has not been one all year, and the internal debate is currently about whether to go the other way.
What to Do With This
Three things follow from this report.
1. Compare your raise to 3.4%, not to zero. If your annual increase came in below that, your purchasing power fell this year even though your paycheck grew. That is the number to bring to a compensation conversation.
2. Check what your cash is earning. With inflation at 3.4%, money in an account paying the 0.38% national average is losing more than 3% of its value annually in real terms. Competitive savings accounts have been paying in the low-to-mid 4% range, which is one of the few places you can actually beat inflation on money you might need soon. Our guide to where to keep cash covers the options, and the free after-tax calculator shows what each nets you once tax is accounted for.
3. Attack variable-rate debt. Credit cards near 22% APR are not waiting for the Fed, and with a hike on the table rather than a cut, that cost is more likely to rise than fall. Our payoff guide covers the sequencing.
The next data point worth watching is the August employment report, which will show whether July's decline of 23,000 jobs was a blip or the start of something. Our guide to reading the job market covers what to look at beyond the headline rate.
Frequently Asked Questions
Is 3.4% inflation good or bad?
It is better than 3.5% and worse than the Federal Reserve's 2% target. More usefully for a household: it is currently higher than wage growth of about 3.2%, which means the average worker's purchasing power is still slipping. Direction is improving; the level is still uncomfortable.
Why does the pump feel expensive if gas prices fell in July?
Because two different comparisons are in play. Gasoline fell 2.9% compared with June, but it is 24.6% higher than it was a year ago. Prices spiked earlier in the year and have been coming down from that spike without returning to where they started. Your sense of what fuel "should" cost is anchored to last year; the monthly figure is anchored to last month.
How can shelter rise only 0.1% but cause two-thirds of the increase?
Weight. Housing is the largest single component of the CPI because it is the largest line in most household budgets. A very small percentage move applied to a very large share of spending produces more total impact than a large move in a small category. The same logic applies to your personal budget.
Does cooler inflation mean the Fed will cut in September?
Not necessarily. Core inflation easing to 2.5% weakens the case of the three officials who dissented in July in favor of raising rates, but it remains above the 2% target. The most likely outcome on this data is another hold. Planning your finances around a cut has been a losing assumption throughout 2026.
Should I expect prices to go back down?
Generally no. Falling inflation means prices are rising more slowly, not falling. Actual declines happen in individual volatile categories, such as dairy at -0.5% this month, but the broad price level rarely reverses. What normally closes the gap is income catching up over time, not prices retreating.
Figures in this article come from the Bureau of Labor Statistics Consumer Price Index for July 2026, released August 12, 2026. Current data is published at bls.gov/cpi. This article is informational and is not individualized financial advice.
Financial Disclaimer: This article is for informational purposes only and does not constitute financial advice. Always consult a licensed financial advisor before making financial decisions.

Founder & Editor
Francis founded WealthWire Daily to explain US personal finance using primary sources. He is not a licensed financial advisor.
Discussion & Comments
You Might Also Like
How to Read Inflation Data Without Getting Misled by the Headline
The CPI headline almost never describes your actual cost of living. Here's how to read the report the way an economist does, find the categories that affect your budget, and ignore the rest.

How to Read the Job Market as a Household (Not an Economist)
The unemployment rate can fall while the job market gets worse. Here's how to read employment data for the signals that actually predict your job security, your raise, and when to build cash.
Gas Fell From $4.56 to $3.83. How to Bank the Difference Before It Reverses
Pump prices dropped roughly 50 cents in a month after peaking at $4.56 in May. That's a real raise for driving households, and it will quietly disappear into everyday spending unless you capture it deliberately.